XAT 2016Data Interpretation & LRData Interpretation BasicsHARD+1 / −0.25
Passage
Study the data given in the table below and answer the question that follow:
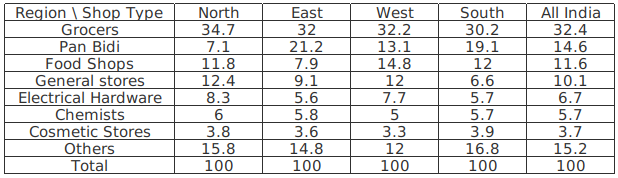
All figures are in percentage
Based on survey of ‘shop types’ Kamath categorized Indian states into four geographical regions as shown in the table above. His boss felt that the categorization was inadequate since important labels were missing. Kamath argued that no further labels are required to interpret the data.
Bala collected the same data five years after Kamath, using the same categorization.
Which of the following statements can DEFINITELY be concluded?
Select an option to reveal the answer and explanation
Practice the full paper
Attempt XAT 2016 Question Paper with real exam interface and instant grading.