The chart below shows the price data for seven shares - A, B, C, D, E, F, and G as a candlestick plot for a particular day. The vertical axis shows the price of the share in rupees. A share whose closing price (price at the end of the day) is more than its opening price (price at the start of the day) is called a bullish share; otherwise, it is called a bearish share. All bullish and bearish shares are shown in green and red colour respectively.
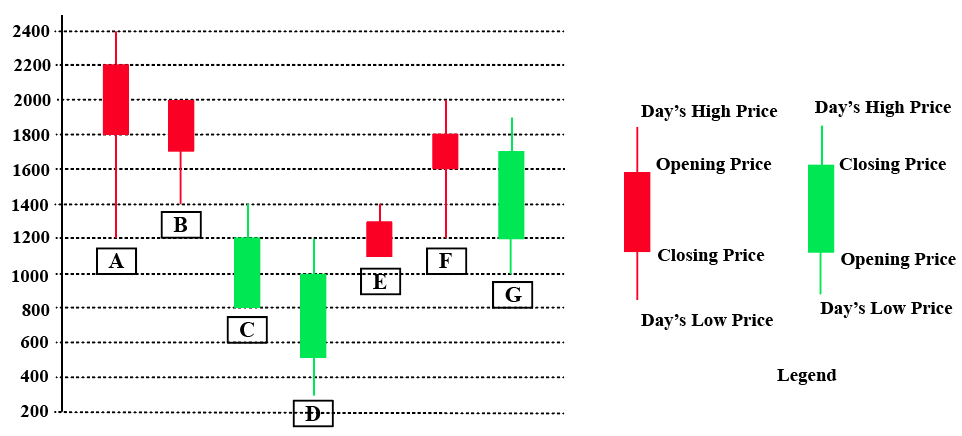
Daily loss for a share is defined as (Opening price - Closing price) / (Opening price). Which among the shares A, B, F and G had the highest daily loss on that day?
Select an option to reveal the answer and explanation
Practice the full paper
Attempt CAT 2024 Slot 1 Question Paper with real exam interface and instant grading.