Study the graph below and answer the questions that follow:
This graph depicts the last eight years’ annual salaries (in Rs. lacs.) offered to student during campus placement. Every year 100 students go through placement process. However, at least one of them fails to get placed. The salaries of all unplaced students are marked zero and represented in the graph.
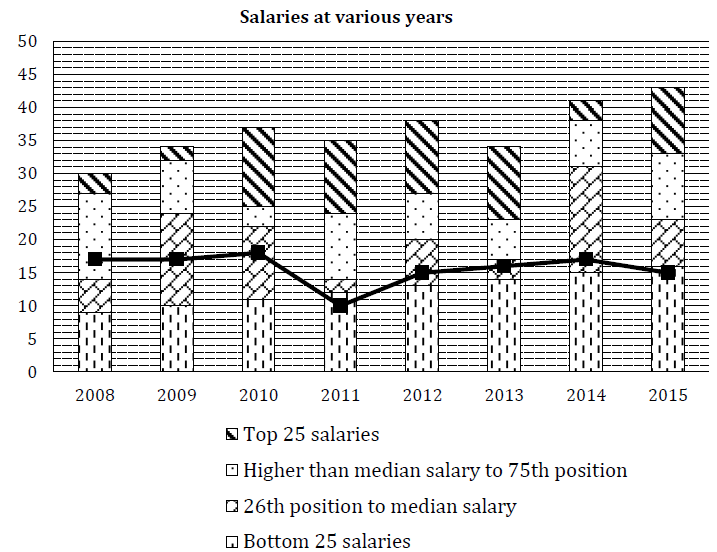
The bold line in the graph presents Mean salaries at various years.
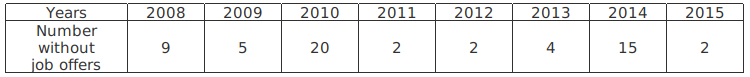
If the average salary is computed excluding students with no offers, in how many years will the new average salary be greater than the existing median salary? Refer the table below for number of students without offers.
Select an option to reveal the answer and explanation
Practice the full paper
Attempt XAT 2016 Question Paper with real exam interface and instant grading.