CatMate
CATXATMock TestsAnalytics
HomeXAT PYQsXAT 2011 Question PaperOf the years indicated below, in which year was the rat…
XAT 2011Data Interpretation & LRChartsMEDIUM+1 / −0.25
Passage

Based on the following information.

The following graphs give annual data of Assets, Sales (as percentage of Assets) and Spending on Corporate Social Responsibility (CSR) (as percentage of Sales), of a company for the period 2004 - 2009.

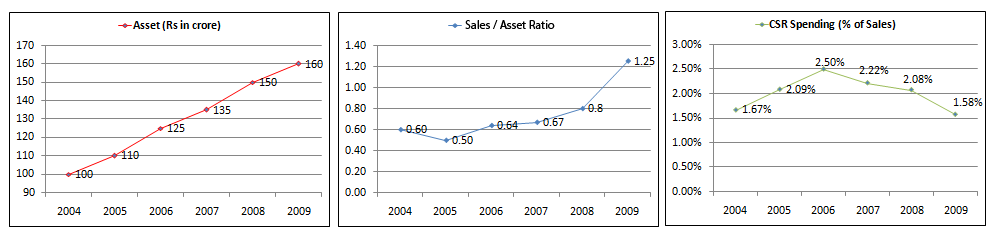
Of the years indicated below, in which year was the ratio of CSR/ Assets the maximum?

Select an option to reveal the answer and explanation

Practice the full paper

Attempt XAT 2011 Question Paper with real exam interface and instant grading.

View Paper →
CatMate

CAT & XAT prep made focused.

Build exam-ready momentum with realistic mocks, safe auto-save, and analytics that surface exactly what to fix next.

Practice

  • CAT Sectional Tests
  • XAT Sectional Tests
  • CAT Previous Year Papers
  • XAT Previous Year Papers

Prepare

  • XAT Preparation
  • Analytics
  • Profile
  • About

Legal

  • Privacy Policy
  • Terms of Use
© 2026 CatMate. All rights reserved.
Made in India