CatMate
CATXATMock TestsAnalytics
HomeXAT PYQsXAT 2012 Question PaperThe difference in the average percentage increase in re…
XAT 2012Data Interpretation & LRChartsHARD+1 / −0.25
Passage

based on the following information
The following graphs shows the revenue (in $ million) of three companies in their initial six years of operations, in an economy which is characterized by a persistent inflation.


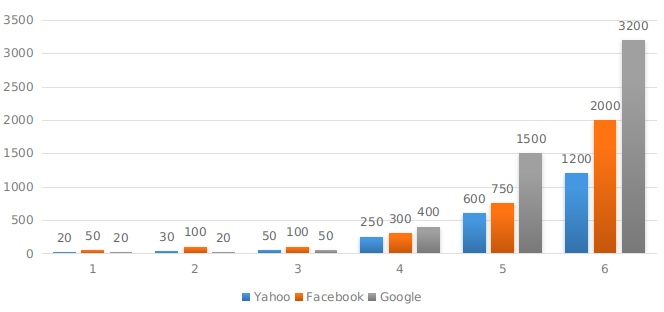
The difference in the average percentage increase in revenues, from 4th to 6th year, of Yahoo and Facebook is:

Select an option to reveal the answer and explanation

Practice the full paper

Attempt XAT 2012 Question Paper with real exam interface and instant grading.

View Paper →
CatMate

CAT & XAT prep made focused.

Build exam-ready momentum with realistic mocks, safe auto-save, and analytics that surface exactly what to fix next.

Practice

  • CAT Sectional Tests
  • XAT Sectional Tests
  • CAT Previous Year Papers
  • XAT Previous Year Papers

Prepare

  • XAT Preparation
  • Analytics
  • Profile
  • About

Legal

  • Privacy Policy
  • Terms of Use
© 2026 CatMate. All rights reserved.
Made in India