The chart below shows the price data for seven shares - A, B, C, D, E, F, and G as a candlestick plot for a particular day. The vertical axis shows the price of the share in rupees. A share whose closing price (price at the end of the day) is more than its opening price (price at the start of the day) is called a bullish share; otherwise, it is called a bearish share. All bullish and bearish shares are shown in green and red colour respectively.
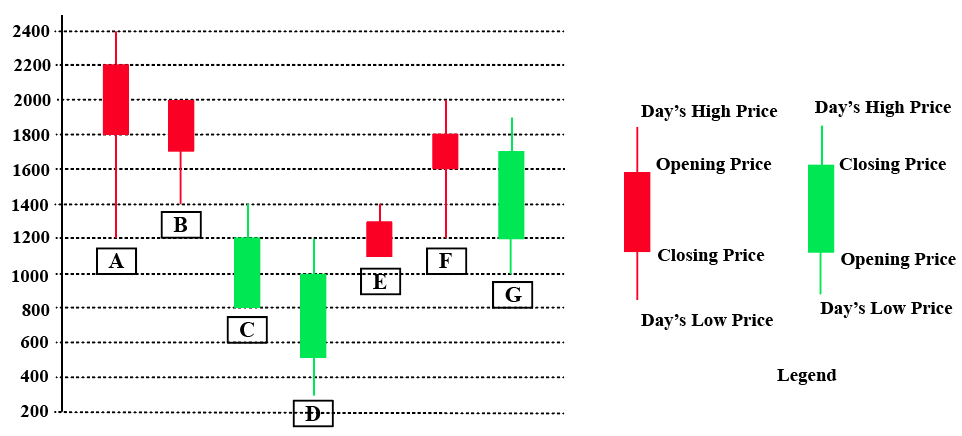
What would have been the percentage wealth gain for a trader, who bought equal numbers of all bullish shares at opening price and sold them at their day’s high?
Select an option to reveal the answer and explanation
Practice the full paper
Attempt CAT 2024 Slot 1 Question Paper with real exam interface and instant grading.