XAT 2014Data Interpretation & LRChartsHARD+1 / −0.25
Passage
Answer the questions based on the following information given below.
The exhibit given below compares the countries (first column) on different economic indicators (first row), from 2000-2010. A bar represents data for one year and a missing bar indicates missing data. Within an indicator, all countries have same scale.
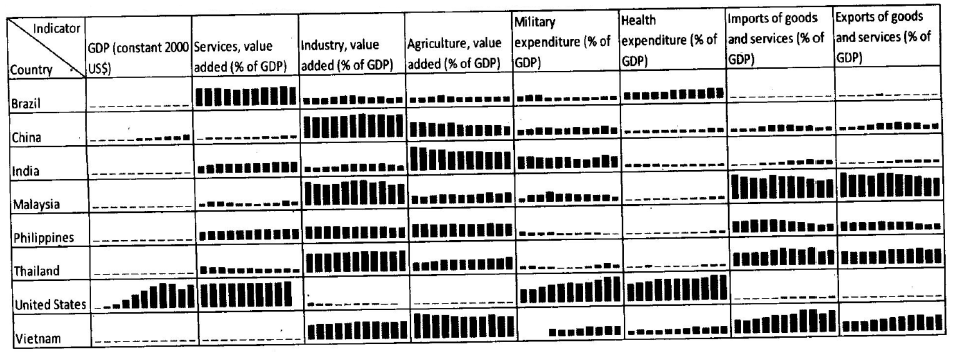
Which country (and which year) has witnessed maximum year-to-year decline in “industry as percentage of GDP”? Given that the maximum value of industry as percentage of GDP is 49.7% and the minimum value of industry as percentage of GDP is 20.02%, in the chart above.
Select an option to reveal the answer and explanation
Practice the full paper
Attempt XAT 2014 Question Paper with real exam interface and instant grading.