XAT 2014Data Interpretation & LRChartsMEDIUM+1 / −0.25
Passage
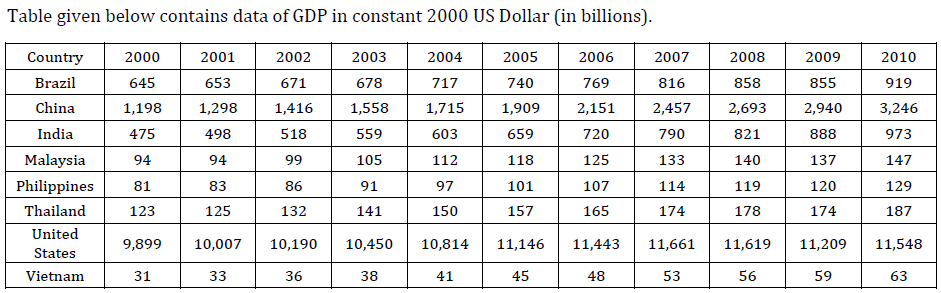
Answer the questions based on the following information given below.
The exhibit given below compares the countries (first column) on different economic indicators (first row), from 2000-2010. A bar represents data for one year and a missing bar indicates missing data. Within an indicator, all countries have same scale.
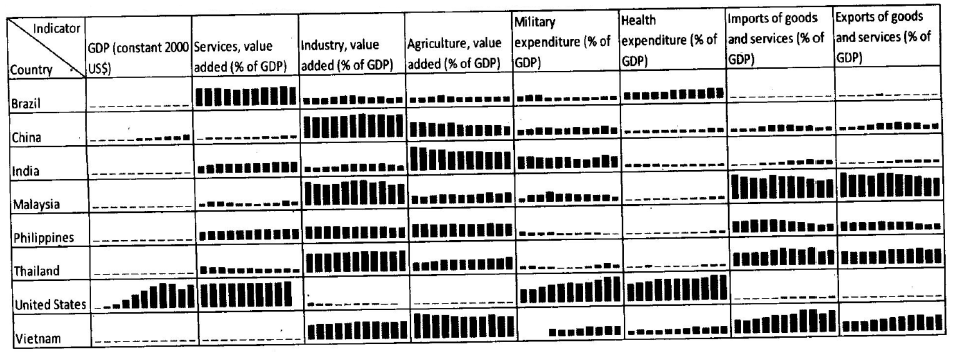
Which of the following countries has shown maximum increase in the “services, value added as % of GDP” from year 2000 to year 2010?
Select an option to reveal the answer and explanation
Practice the full paper
Attempt XAT 2014 Question Paper with real exam interface and instant grading.