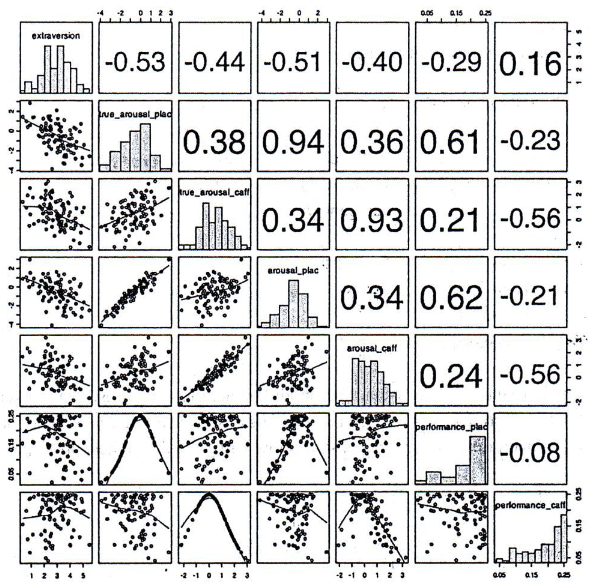
The grid below captures relationships among seven personality dimensions: "extraversion", "true_arousal_plac", "true_arousal_caff”, "arousal_plac", "arousal_caff”, "performance_plac", and "performance caff”. The diagonal represents histograms of the seven dimensions. Left of the diagonal represents scatterplots between the dimensions while the right of the diagonal represents quantitative relationships between the dimensions. The lines in the scatterplots are closest approximation of the points. The value of the relationships to the right of the diagonal can vary from -1 to +1, with -1 being the extreme linear negative relation and +1 extreme linear positive relation. (Axes of the graph are conventionally drawn).
Which of the following is true?
Select an option to reveal the answer and explanation
Practice the full paper
Attempt XAT 2017 Question Paper with real exam interface and instant grading.