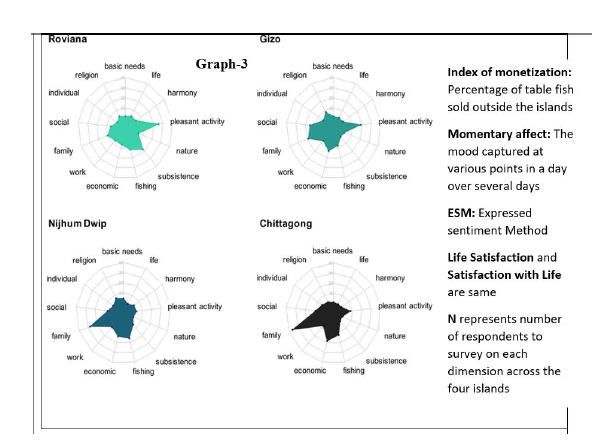
Go through the information given below, and answer the THREE questions that follow.Comprehension:The three graphs below capture relationship between economic (and social) activities and subjective well-being. The first graph (Graph-1) captures relationship between GDP (percapita) and Satisfaction with life, across different countries and four islands: Gizo, Roviana, Niijhum Dwip, and Chittagong. The Graph-2 captures three different measures of subjective well-being (Satisfaction with life, Affect Balance and Momentary Affect) across the four islands, which have different levels monetization (Index). The Graph-3 captures levels of thirteen different socio-economic activities across four islands.
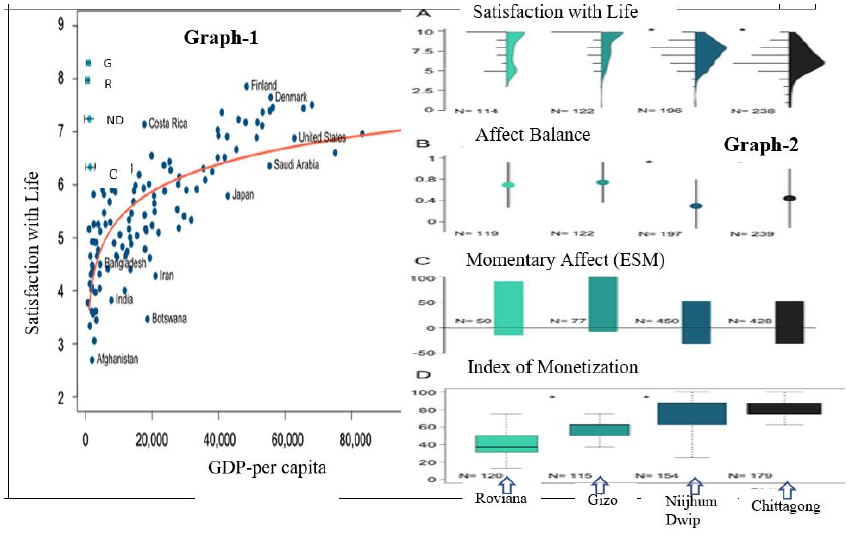
Which of the following will BEST capture the relationship between GDP (x-axis) and Life Satisfaction (y-axis) of countries?
Select an option to reveal the answer and explanation
Practice the full paper
Attempt XAT 2023 Question Paper with real exam interface and instant grading.